

We've moved our customer support from X to Facebook Messenger to offer you more focused support. For other contact options visit the Thames Water website.
- Tweets196K
- Following239
- Followers73.3K
- Likes4.8K






ALT September water update infographic for the Thames Valley area. The graphic shows rainfall at 50% of the long-term average, reservoir levels at 68%, groundwater levels described as notably low, groundwater dryness marked as the driest on record, and river levels below average. The information is displayed over a blurred background image of a reservoir, with water-themed blue and white branding.

ALT September water update infographic for the London area. The graphic shows rainfall at 51% of the long-term average, reservoir levels at 56%, groundwater levels described as normal to exceptionally low, groundwater dryness marked as the driest on record, and river levels below average. The information is displayed over a blurred background image of a reservoir, with water-themed blue and white branding.


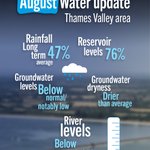
ALT Graphic titled "August Water update - Thames Valley area" on a blue background with a blurred reservoir image. The graphic shows key water resource indicators for August: rainfall at 47% of the long-term average, reservoir levels at 76%, groundwater levels below normal to notably low, groundwater dryness drier than average, and river levels below average. Decorative icons include a rain cloud and a water level gauge.

ALT Graphic titled "August Water update - London area" on a blue background with a blurred reservoir image. The graphic shows key water resource indicators for August: rainfall at 31% of the long-term average, reservoir levels at 61%, groundwater levels below normal to normal, groundwater dryness drier than average, and river levels below average. Decorative icons include a rain cloud and a water level gauge.

ALT Two utility workers wearing bright orange high-visibility clothing, white hard hats, safety glasses and gloves stand beside a branded water company van on a residential street. The workers are reviewing information on a handheld tablet device, with suburban houses visible in the background on a sunny day.
