

SME investing minus the circus. IPOs, OFS & business models. Market survivor. Not SEBI registered—just trying to be less wrong than yesterday.
India
Joined November 2013
- Tweets1K
- Following4
- Followers837
- Likes1.2K
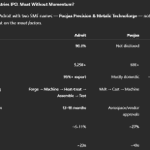
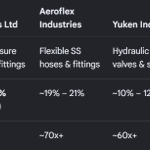






BLS Polymers IPO Investment Note: Key Insights 🧵
• The Margin Illusion: Net Profit (PAT) skyrocketed 259% (FY24-26) while revenues stalled at just 17.9% growth. This growth is entirely margin-driven due to dropping raw material costs, not higher sales volumes.
• Working Capital Trap: Cash Flow from Operations (CFO) was just ₹2.68 Cr in FY25 against a PAT of ₹21.14 Cr. Infrastructure clients stretch payment cycles, leading to high receivables and negative CFO in Q1 FY27. This explains why ₹89.50 Cr of IPO proceeds is going straight to working capital.
• Capacity Expansion: The Goa facility operates at 35,251 MTPA. Management is spending ₹77.56 Cr of the fresh issue to expand capacity, with new production lines expected to contribute to the top line within 12 to 18 months post-allotment.
• Crude Oil Vulnerability: Core raw materials (resins/plasticizers) are heavily tied to global oil cycles. Any spike in crude prices squeezes gross margins due to a 3-to-6-month time lag in passing costs to infrastructure buyers.
• Does a Moat Exist? The high net block turnover proves low entry barriers; any peer can replicate the setup with minimal capital. However, a micro-moat exists via 127 customized polymer grades that enjoy formal government/PSE enlistment, driving a 93.92% repeat customer rate.
• Promoter Skin in the Game: The IPO is a 100% fresh issue (₹255 Cr) with zero Offer for Sale (OFS). Promoters are not selling a single share, retaining a robust 71.53% post-listing stake.
• Valuation Stretch: At the upper band of ₹150, the implied P/E sits at ~25.04x. This is a massive premium compared to pure-play compounding giants like DDev Plastiks (trading around ~13x P/E), leaving little room for execution errors.
Disclaimer: For educational purposes only. Not financial or investment advice. IPO investing carries high market risk. Please consult a SEBI-registered financial advisor before making any investment decisions.
Yali Deeptech Fund locked in a massive 4.2x return on its investment in Tonbo Imaging, selling 24 lakh shares at an average price of ₹1,069.22 on listing day vs an acquisition cost of ₹250.
How did they exit instantly on Day 1? 🕵️♂️
Under Regulation 17 of SEBI’s ICDR Regulations, the standard 6-month post-IPO lock-in for pre-issue capital does not apply to SEBI-registered Category I & II AIFs—provided they held the shares for at least 6 months before filing the RHP.
Yali held their stake since March 2025, meeting the criteria perfectly and allowing them to legally liquidate their position directly into market hours. This massive institutional supply explains why listing day delivery volumes easily outpaced the actual IPO float.

Tonbo Imaging: Bumper Listing, But Selling Pressure?
Post-IPO promoter holding: ~14% (down from 17.43%).
FY24–FY26 revenue CAGR: **~-8%** — sales fell from ₹428cr to ₹363cr.
Yali Deeptech Fund reportedly sold 24L shares at avg. ₹1,069 vs ₹250 acquisition cost.
Promoters have already diluted. AIFs and early investors are cashing out. **Who absorbs the next wave of selling?**
*Personal observation, not investment advice. Figures based on IPO disclosures and reported trades; DYDD.*
🔍
Tonbo Imaging is launching an ₹852.18 Cr IPO (100% OFS).
While its ITAR-free electro-optics tech is highly advanced, Here is a breakdown of the key factors.
👇Tonbo Imaging India IPO Investment Note
📊 The Core Metrics:
• Peer Comparison: Revenue fell 22.7% & PAT dropped 30.1% in FY26. Pure-play defense peers (Data Patterns, Paras) show much stronger growth.
• Promoter Stake: Founders hold just 17.43% pre-IPO, dropping to ~14.6% post-IPO. Extremely low "skin in the game".
• Asset Efficiency: Asset-light model means outsourcing assembly to contract manufacturers. Net Fixed Asset Turnover is high at 14.6x, but working capital stretched to a massive 517 days.
3/3 ⚠️ Valuation & Order Book:
• Order Book: Stood at ₹314.24 Cr—only 0.87x of FY26 revenue, providing weak visibility.
• Valuation: Priced at ₹665–₹700, translating to a steep 78.83x P/E on FY26 earnings.
• Recent Trend: Slipped into a net loss of -₹17.74 Cr in Q1 FY27.
(Disclaimer: This is a personal investment note for educational/informational purposes only. Not financial advice. Please consult a SEBI-registered advisor before investing.)
IPO Valuation Critique: Paras Healthcare 🩺🚨
(Educational Review Only. Not a SEBI Registered Investment Advisor. Views are personal based on public RHP data. No buy/sell recommendation.)
Don't let merchant bankers trap retail money in another overvalued IPO. The "cheap" 37x annualised P/E is a complete illusion:
Accounting Glitch? ₹16.2 Cr of Q1 profit is a one-time "deferred tax credit"—not cash from treating patients.
The Cash Trap: Government schemes make up 43% of revenue, locking cash in massive 86-day receivable delays.
Massive Attrition: A staggering 60%+ staff turnover risks operational quality and escalates costs.
PE Exit : 65% of the issue (₹950 Cr) is an OFS for Creador PE to dump shares at peak valuation.
The Mismatch (True Operational Trailing P/E):
Paras Healthcare: 171.06x 🚨 (Tier-2/3 heavy)
Medanta (Global Health): 64.46x
Max Healthcare: 62.10x
Mutual funds are absorbing this overvaluation with public SIP liquidity because it’s "other people's money"—just like recent post-listing crashes. Protect your capital. 🛑📉
(LEGAL DISCLAIMER: Under Section 3(1) of SEBI (Research Analysts) Regulations, 2014, the author clarifies that this post is strictly for general educational/informational purposes and does not constitute financial, investment, or legal advice. The author holds no financial interest or position in the upcoming IPO. Investors must consult a certified financial advisor before taking any market exposure.)
**Zetwerk: 5% Listing Gain in a Weak Market! 🇮🇳**
Even in a poor market, Zetwerk delivered a 5% listing gain. The market appreciated our own entrepreneurs who built a world-first, unique manufacturing platform.
Congratulations to everyone who applied, received an allotment and made a decent listing gain!
A reminder that **unique businesses with a compelling story can still earn market appreciation, even in difficult conditions.**
*Personal observation, not investment advice. DYDD.*
ZETWERK IPO: NO DIRECT PEER — INDUSTRIAL DISRUPTOR OR VALUATION TRAP? 🏭📊
Zetwerk is not merely a manufacturing company. It is building a technology-led B2B manufacturing ecosystem with a differentiated business model.
🔹 PROMOTERS: First-generation entrepreneurs in their mid-30s, potentially combining experience, energy and a long execution runway.
🔹 UNIQUE BUSINESS MODEL: B2B platform + 800+ engineers + asset-light MSME manufacturing network + selective in-house factory infrastructure.
🔹 HOW IT WORKS: A data-centre company needs transformers. Zetwerk's engineers understand specifications, design the solution, allocate production to suitable manufacturing partners and manage execution. Complex processes can be handled in its own facilities.
📈 SCALE: FY26 revenue reportedly reached ₹15,913 crore, up 40.4%. Adjusted EBITDA: ₹421 crore. Reported net loss: ₹1,606 crore.
💥 WHY WAS THE FY26 LOSS SO LARGE?
The headline loss needs to be examined beyond operating performance:
Non-cash ESOP/share-based compensation: Approximately ₹800 crore of founder and employee share-based charges reportedly weighed on reported earnings. These are non-cash accounting expenses in the period, although equity compensation has an economic cost through dilution.
Civil infrastructure exit: A reported ₹450 crore write-down associated with exiting legacy civil infrastructure operations added to the loss.
Low-margin metal trading: Ring-fencing the low-margin commodity-sourcing business, reportedly operating at around 1.24% EBITDA margin, could improve transparency and focus on higher-value manufacturing. It does not automatically eliminate the underlying economic risks.
These items may explain a substantial part of the loss, but the entire ₹1,606 crore loss should not be dismissed as unreal. Recurring expenses, finance costs and cash-flow performance still matter.
💰 THE FY27 TURNAROUND THESIS
Projected FY27 PAT: ₹180–250 crore — an estimate, not a certainty.
1️⃣ Debt reduction: Approximately ₹2,160 crore of IPO proceeds is earmarked for debt repayment, potentially reducing interest costs.
2️⃣ Operating leverage: Projected adjusted EBITDA of ₹580–620 crore, assuming revenue growth and execution improvements.
3️⃣ Lower exceptional charges: FY26's civil infrastructure write-down may not recur at the same level, although future ESOP expenses and other charges remain possible.
Illustrative bridge: ₹580–620 crore adjusted EBITDA, less ₹110–130 crore finance costs, ₹180–200 crore depreciation and other charges, and ₹30–50 crore estimated tax, supports a potential positive PAT—subject to actual accounting and tax treatment.
🔍 POTENTIAL PEER FRAMEWORK — NOT DIRECT COMPARABLES
Dixon Technologies: A reference point for the EMS/manufacturing side of the business.
Delhivery: A reference point for the technology-led platform-plus-infrastructure side.
Zetwerk sits somewhere between these two business architectures. It combines engineering-led custom manufacturing, a distributed MSME partner ecosystem and selective owned production infrastructure. There is no obvious like-for-like listed global peer.
🎯 WHO SHOULD CONSIDER THIS IPO?
In my view, this may not be suitable for retail investors with limited funds or low risk tolerance. It may interest HNIs and financially sophisticated investors who understand the business, can tolerate substantial volatility and are willing to underwrite a differentiated but still unproven profitability trajectory.
A three-year investment thesis would rest on successful debt reduction, sustained growth, improving margins and conversion of EBITDA into PAT and operating cash flow. This is a high-risk thesis—not a guaranteed three-year wealth creator.
MY TAKE: A potentially unique industrial platform with considerable upside if execution succeeds, but valuation, working capital and profitability remain the critical tests.
DISCLAIMER — FOR SEBI COMPLIANCE: This post is for educational and informational purposes only. It is not investment advice, a research report, a buy/sell recommendation or a solicitation to invest. The views expressed are analytical opinions, not a recommendation to any specific investor category. All financial figures and projections require independent verification against the RHP, audited financial statements and stock-exchange disclosures. Forward-looking estimates are uncertain and actual outcomes may differ materially. No assurance of returns or profitability is given. Investors should assess their own financial circumstances, risk tolerance and investment horizon and consult a SEBI-registered investment adviser where appropriate. Securities investments are subject to market risks, including possible loss of capital.
**Bonfiglioli Transmissions: Flat Listing, No Surprise.**
But where is the growth, my Italian friends?
At around 75% capacity utilisation, why no meaningful capacity expansion? If the growth opportunity is so attractive, why is the IPO largely an OFS?
India is not a cash-out destination for foreign promoters.
Nirmalaji Market did its job today: **no listing pop, no easy exit premium.** A reminder that Indian investors are looking beyond a foreign brand name.
Good business? Maybe. But show us the growth, the capex and the skin in the game.
Disclaimer: Personal observation, not investment advice. Not SEBI registered. DYDD.
Bonfiglioli Transmissions IPO Deep-Dive: Financial Marvel or Promoter Cash-Out? 🚨
🐂 The Bull Case: An Asset-Light Engineering Powerhouse
Unmatched Machine Efficiency: Boasts a spectacular Fixed Asset Turnover of 7.2x—vastly outperforming the industrial engineering average of ~4.0x due to a highly optimized, localized assembly model.
Premium Returns: The business commands a stellar 34% ROCE and strong operating margins that expanded to 19.8% in H1CY26.
Production Headroom: Operates at ~75% capacity utilization, giving it plenty of room to scale without requiring immediate, heavy capital expenditure.
🐻 The Bear Case: The Working Capital & Governance Friction
. The real bottleneck isn't factory capacity—it is a sluggish Working Capital Cycle locked up in high inventory days (~90 days) and long debtor cycles (~80 days) dictated by powerful OEM clients.The Turnover Illusion: While fixed asset turnover is great, the Total Asset Turnover drops to 1.51x
Zero Growth Capital: The issue is a 100% Offer for Sale (OFS). The entire ₹2,533 Cr goes straight to the Italian promoters. The company receives ₹0 to support its ballooning working capital needs as it expands.
🔍 The Hidden Risk Everyone is Ignoring: The Royalty Drain
High Promoter Outflow: Bonfiglioli India pays a steep 4.5% annual royalty to its Italian parent—up from 4.2% in CY22.
Peer Comparison: Standard MNC peers listed in India (like Bosch, ABB, and Schaeffler) typically cap parent royalties between 2% to 3%.
The Reality: This 4.5% rate siphons roughly ₹90 Cr annually out of the Indian listed entity. Because the parent is using this IPO to extract capital rather than invest it, any future upward revisions to this royalty agreement present a silent dilution risk for public shareholders.
At a forward P/E of 37.07x, it is priced reasonably against the industry average (51.61x), but investors must weigh excellent operating efficiency against structural cash extraction.
⚠️ SEBI Disclaimer: I am not a SEBI registered investment advisor. This analysis is purely for educational and informational purposes based on the Red Herring Prospectus (RHP) and publicly available broker notes. This is not financial advice or a recommendation to buy, sell, or subscribe to the IPO. Please consult a certified financial advisor before making any investment decisions.
Growth Doesn’t Wait for a Bull Market: Supreme Power & Kheria Autocorp
Supreme Power Equipment up nearly 10% and Kheria Autocorp up almost 17%!
What stands out? Growth, capacity expansion and management guidance—even when market sentiment is weak.
Supreme Power Equipment
🔹 FY27 revenue guidance raised to ₹300–350 Cr from ₹250–300 Cr.
🔹 Peak revenue of ₹550–600 Cr pulled forward to FY28 from FY29.
🔹 Order book at ₹565.8 Cr, with 75–78% in power transformers.
🔹 PAT margin guidance of 9–12%.
Kheria Autocorp
🔹 H1 FY27 revenue of ₹72.27 Cr, up 31.38% YoY.
🔹 Existing capacity utilisation at 98.9%.
🔹 Planned 2,400 MTPA capacity addition at Sanand-II.
🔹 Commercial production guided for January 2027.
The lesson: When companies deliver growth, raise guidance and lay out a credible capex roadmap, the market can take notice—even in a weak environment.
But guidance is not delivery. Plant ramp-up, timely execution and sustainable margins remain the key tests.
Disclaimer: Personal observations for educational purposes only. Not SEBI registered. Not investment advice or a recommendation to buy or sell. I may hold or trade these stocks; my views may be biased. DYDD.THIS ARE COMPANY NOTIFICATIONS TO EXCHANGES AND CONCALL TRANSCRIPT
Vaibhav Vyapaar (LoanFront) 👀 — Interesting Bulk Deals!
🟢 Capfront Technologies (Promoter??) — Bought 5.40 lakh shares @ ₹53.12.
🟢 Getfive Opportunity Fund-I — Bought 5.80 lakh shares @ ₹52.90.
🔴 Innovative Vision Fund — Sold 5.76 lakh shares.
Why is this interesting?
Capfront Technologies is the promoter of Vaibhav Vyapaar, the company behind LoanFront, its digital lending platform.
And Getfive is the IPO's merchant banker — its associated fund has now bought 5.80 lakh shares in the market.
Promoter buying + merchant-banker's associated fund buying, while another fund sells.
Coincidence or confidence? 👀
Disclaimer: This is a preliminary observation based on publicly available information and bulk-deal data. If any detail is incorrect, please correct me.
Personal observation, not investment advice. DYDD.
ZETWERK IPO: NO DIRECT PEER — INDUSTRIAL DISRUPTOR OR VALUATION TRAP? 🏭📊
Zetwerk is not merely a manufacturing company. It is building a technology-led B2B manufacturing ecosystem with a differentiated business model.
🔹 PROMOTERS: First-generation entrepreneurs in their mid-30s, potentially combining experience, energy and a long execution runway.
🔹 UNIQUE BUSINESS MODEL: B2B platform + 800+ engineers + asset-light MSME manufacturing network + selective in-house factory infrastructure.
🔹 HOW IT WORKS: A data-centre company needs transformers. Zetwerk's engineers understand specifications, design the solution, allocate production to suitable manufacturing partners and manage execution. Complex processes can be handled in its own facilities.
📈 SCALE: FY26 revenue reportedly reached ₹15,913 crore, up 40.4%. Adjusted EBITDA: ₹421 crore. Reported net loss: ₹1,606 crore.
💥 WHY WAS THE FY26 LOSS SO LARGE?
The headline loss needs to be examined beyond operating performance:
Non-cash ESOP/share-based compensation: Approximately ₹800 crore of founder and employee share-based charges reportedly weighed on reported earnings. These are non-cash accounting expenses in the period, although equity compensation has an economic cost through dilution.
Civil infrastructure exit: A reported ₹450 crore write-down associated with exiting legacy civil infrastructure operations added to the loss.
Low-margin metal trading: Ring-fencing the low-margin commodity-sourcing business, reportedly operating at around 1.24% EBITDA margin, could improve transparency and focus on higher-value manufacturing. It does not automatically eliminate the underlying economic risks.
These items may explain a substantial part of the loss, but the entire ₹1,606 crore loss should not be dismissed as unreal. Recurring expenses, finance costs and cash-flow performance still matter.
💰 THE FY27 TURNAROUND THESIS
Projected FY27 PAT: ₹180–250 crore — an estimate, not a certainty.
1️⃣ Debt reduction: Approximately ₹2,160 crore of IPO proceeds is earmarked for debt repayment, potentially reducing interest costs.
2️⃣ Operating leverage: Projected adjusted EBITDA of ₹580–620 crore, assuming revenue growth and execution improvements.
3️⃣ Lower exceptional charges: FY26's civil infrastructure write-down may not recur at the same level, although future ESOP expenses and other charges remain possible.
Illustrative bridge: ₹580–620 crore adjusted EBITDA, less ₹110–130 crore finance costs, ₹180–200 crore depreciation and other charges, and ₹30–50 crore estimated tax, supports a potential positive PAT—subject to actual accounting and tax treatment.
🔍 POTENTIAL PEER FRAMEWORK — NOT DIRECT COMPARABLES
Dixon Technologies: A reference point for the EMS/manufacturing side of the business.
Delhivery: A reference point for the technology-led platform-plus-infrastructure side.
Zetwerk sits somewhere between these two business architectures. It combines engineering-led custom manufacturing, a distributed MSME partner ecosystem and selective owned production infrastructure. There is no obvious like-for-like listed global peer.
🎯 WHO SHOULD CONSIDER THIS IPO?
In my view, this may not be suitable for retail investors with limited funds or low risk tolerance. It may interest HNIs and financially sophisticated investors who understand the business, can tolerate substantial volatility and are willing to underwrite a differentiated but still unproven profitability trajectory.
A three-year investment thesis would rest on successful debt reduction, sustained growth, improving margins and conversion of EBITDA into PAT and operating cash flow. This is a high-risk thesis—not a guaranteed three-year wealth creator.
MY TAKE: A potentially unique industrial platform with considerable upside if execution succeeds, but valuation, working capital and profitability remain the critical tests.
DISCLAIMER — FOR SEBI COMPLIANCE: This post is for educational and informational purposes only. It is not investment advice, a research report, a buy/sell recommendation or a solicitation to invest. The views expressed are analytical opinions, not a recommendation to any specific investor category. All financial figures and projections require independent verification against the RHP, audited financial statements and stock-exchange disclosures. Forward-looking estimates are uncertain and actual outcomes may differ materially. No assurance of returns or profitability is given. Investors should assess their own financial circumstances, risk tolerance and investment horizon and consult a SEBI-registered investment adviser where appropriate. Securities investments are subject to market risks, including possible loss of capital.
Zetwerk IPO: A Business That Defies Easy Valuation.
Spent considerable time today understanding Zetwerk’s business model and valuation.
It’s a unique business, and finding the right peer for comparison is surprisingly difficult.
A few interesting insights emerged when I looked beyond the headline numbers.
Will share my analysis tomorrow—with logic, figures and some unconventional valuation perspectives.
Sometimes, the most interesting IPOs are the hardest to value.
Vibhav Vyappar 👀 | High risk, interesting possibility
The IPO saw weak subscription, and risks are real: a small lending player focused on unsecured loans could face stress from rising interest rates, defaults and funding constraints.
Yet, a few possibilities make this worth tracking over the long term—if management executes well.
• IPO proceeds could take net worth to ~₹90 Cr, potentially supporting ~2× leverage and a lending book of ~₹270–300 Cr, subject to actual capital availability and regulatory constraints.
• Current borrowing costs of ~17% could potentially decline if improved creditworthiness enables NCD funding at 12–13%, supporting better interest spreads. This is a possibility, not a certainty.
• GetFive Merchant Bankers’ previous IPOs, including iWare TeamTech and EPW, have been encouraging so far. It will be interesting to see how Vibhav Vyappar executes.
The thesis is execution-dependent, not a prediction. Funding costs, credit quality, collections and capital access will be key to watch.
Disclosure: I have been allotted shares in this IPO, which may create a potential conflict of interest and bias my views. This post reflects personal observations, not investment advice, a recommendation to buy/sell/hold, or a solicitation. The figures and scenarios mentioned are indicative and subject to verification; outcomes are uncertain. Please review the offer documents, assess the risks independently and consult a SEBI-registered investment adviser if needed. Investments in securities are subject to market risks; read all related documents carefully. Past performance does not guarantee future results.
This quoted post is unavailable.
Shellz India IPO 🍬: Doubling Capacity Before Fixing Utilisation?
There’s plenty of positive commentary and some reputed names in the anchor book. But a balanced discussion must highlight the red flags too. A strong anchor book doesn’t make business risks disappear. Let’s discuss both sides before forming an opinion.
🚩 Key concerns: • FY26 revenue growth: just 3% • EBITDA margin jumped to 15.7%, but operating cash flow was -₹11.3 Cr • Existing plant utilisation: only 66.5% • Inventory days: 126 → 187 • Debt/equity: 1.71x • ₹22.2 Cr goodwill; ₹20.8 Cr disputed tax demands
🏭 The big operational risk: Manufacturing is planned to shift from Delhi to Sonipat, Haryana. Production interruptions, transition costs, logistics changes and delays could affect supply and profitability.
Capacity is set to rise from 17,100 MT to 34,500 MT, yet the RHP gives no clear commissioning or ramp-up timeline.
Key question: Why nearly double capacity when the existing plant is only ~67% utilised?
⚠️ Disclaimer: For educational purposes only. Not investment advice or a buy/sell recommendation. Figures are based on the RHP and cited IPO disclosures; verify independently before investing.DYDD
🚀 FusionCX IPO Closed Today! 🚀
If you are looking at the long-term future of this stock, ignore the short-term noise. These 4 critical pillars will decide its trajectory: 👇
1️⃣ Promoter Stake Post-IPO 👑
Even after the fresh issue and Offer for Sale (OFS), the promoters are retaining massive skin in the game. The promoter holding will stand at a rock-solid ~81.82% post-IPO (~77.35% on a fully diluted basis), down from 98.46%. This exceptionally high majority control ensures long-term management stability and alignment with minority shareholders.
2️⃣ The M&A Acquisition Engine 🎯
Fusion CX is an aggressive, serial shopper. With 16 international boutique acquisitions under their belt since 2007 (and 6 since last year alone), they don't just wait for organic growth—they buy entry tickets straight into lucrative global sectors like Telecom and Healthcare.
3️⃣ Heavyweight Institutional Trust (75% QIB Quota) 🏛️
The issue is structurally built for big money, with a massive 75% of the quota reserved for QIBs. The anchor book is a powerhouse, backed by elite institutional names like Quant MF, Kotak Mahindra Life Insurance, and marquee HNIs like Ashish Kacholia’s Bengal Finance. When the smartest minds in the market buy in at the absolute top price band of ₹289, you pay attention.
4️⃣ Explosive & Robust Growth Metrics 📈
The financial trajectory is undeniable. Revenue scaled from ₹991 Cr (FY24) to ₹1,818 Cr (FY26), while Net Profit exploded 4.6x to ₹169.8 Cr. Driven by massive foreign inflows (88.7% export revenue), they are converting this growth into strong cash flows to become completely debt-free post-IPO.
💬 The Long View: This isn't a quick listing-gain flip. It is a fundamental compounding play backed by institutional giants, high promoter conviction, and a proven global expansion engine.
The Bear Case: The Risks I Evaluated
To stay objective, I had to look closely at the counter-arguments before hitting submit:
The AI Disruption Threat: At its core, this remains a people-heavy BPO business (employee costs eat 65.6% of revenue). Routine voice and chat tasks face long-term disruption risks from evolving Generative AI.
Acquisition Dependency: Because their growth relies heavily on international buyouts, goodwill and intangibles are their largest assets. Any future integration failures could lead to heavy balance sheet write-downs.
At-Par Valuation: At a 21.55x P/E, the IPO isn't priced at a steep discount. It sits right at par with listed industry peers like Firstsource (22.2x) and Sagility (21.6x).
💬 : For me, the massive promoter alignment, institutional backing, and debt-free status outweigh the structural BPO headwinds. This is a fundamental compounding bet on global AI operations and strategic buyouts.
Did you end up applying on the final day, or did the risks keep you on the sidelines? Let's discuss below! 👇
⚠️ SEBI Disclaimer: I am not a SEBI-registered investment advisor. This post is for educational and informational purposes only and does not constitute financial advice. Equity and IPO investments are subject to market risks. Please read the RHP thoroughly and consult your financial advisor before investing.
This quoted post is unavailable.
🔍
Tonbo Imaging is launching an ₹852.18 Cr IPO (100% OFS).
While its ITAR-free electro-optics tech is highly advanced, Here is a breakdown of the key factors.
👇Tonbo Imaging India IPO Investment Note
📊 The Core Metrics:
• Peer Comparison: Revenue fell 22.7% & PAT dropped 30.1% in FY26. Pure-play defense peers (Data Patterns, Paras) show much stronger growth.
• Promoter Stake: Founders hold just 17.43% pre-IPO, dropping to ~14.6% post-IPO. Extremely low "skin in the game".
• Asset Efficiency: Asset-light model means outsourcing assembly to contract manufacturers. Net Fixed Asset Turnover is high at 14.6x, but working capital stretched to a massive 517 days.
3/3 ⚠️ Valuation & Order Book:
• Order Book: Stood at ₹314.24 Cr—only 0.87x of FY26 revenue, providing weak visibility.
• Valuation: Priced at ₹665–₹700, translating to a steep 78.83x P/E on FY26 earnings.
• Recent Trend: Slipped into a net loss of -₹17.74 Cr in Q1 FY27.
(Disclaimer: This is a personal investment note for educational/informational purposes only. Not financial advice. Please consult a SEBI-registered advisor before investing.)
HD Fire Protect IPO: Deep-Dive Note 🧯
• The Moat: India’s top industrial safety exporter with a massive certification barrier (21 UL / 87 FM approvals).
• The Trap: Total asset turnover drops to 1.13x (vs ~4.7x fixed asset turnover) due to a 102-day working capital lock-up and a huge ₹188Cr cash drag.
• The Mix: Capacity utilization slid to 63.4%, but revenue rose as production shifted to low-volume, high-value customized systems.
• The Friction: Pricing sits at a demanding ~40.7x P/E despite a ~15.2% PAT CAGR, as bottom-line growth slowed heavily to 6.4% in FY26.
• The Cushion: Completely debt-free with a strong 30.75% EBITDA margin and highly resilient, robust Cash Flow from Operations (~₹92.5Cr).
Disclaimer: For educational purposes only. Not financial advice. Read the RHP before investing.
Bonfiglioli Transmissions IPO Deep-Dive: Financial Marvel or Promoter Cash-Out? 🚨
🐂 The Bull Case: An Asset-Light Engineering Powerhouse
Unmatched Machine Efficiency: Boasts a spectacular Fixed Asset Turnover of 7.2x—vastly outperforming the industrial engineering average of ~4.0x due to a highly optimized, localized assembly model.
Premium Returns: The business commands a stellar 34% ROCE and strong operating margins that expanded to 19.8% in H1CY26.
Production Headroom: Operates at ~75% capacity utilization, giving it plenty of room to scale without requiring immediate, heavy capital expenditure.
🐻 The Bear Case: The Working Capital & Governance Friction
. The real bottleneck isn't factory capacity—it is a sluggish Working Capital Cycle locked up in high inventory days (~90 days) and long debtor cycles (~80 days) dictated by powerful OEM clients.The Turnover Illusion: While fixed asset turnover is great, the Total Asset Turnover drops to 1.51x
Zero Growth Capital: The issue is a 100% Offer for Sale (OFS). The entire ₹2,533 Cr goes straight to the Italian promoters. The company receives ₹0 to support its ballooning working capital needs as it expands.
🔍 The Hidden Risk Everyone is Ignoring: The Royalty Drain
High Promoter Outflow: Bonfiglioli India pays a steep 4.5% annual royalty to its Italian parent—up from 4.2% in CY22.
Peer Comparison: Standard MNC peers listed in India (like Bosch, ABB, and Schaeffler) typically cap parent royalties between 2% to 3%.
The Reality: This 4.5% rate siphons roughly ₹90 Cr annually out of the Indian listed entity. Because the parent is using this IPO to extract capital rather than invest it, any future upward revisions to this royalty agreement present a silent dilution risk for public shareholders.
At a forward P/E of 37.07x, it is priced reasonably against the industry average (51.61x), but investors must weigh excellent operating efficiency against structural cash extraction.
⚠️ SEBI Disclaimer: I am not a SEBI registered investment advisor. This analysis is purely for educational and informational purposes based on the Red Herring Prospectus (RHP) and publicly available broker notes. This is not financial advice or a recommendation to buy, sell, or subscribe to the IPO. Please consult a certified financial advisor before making any investment decisions.
SMT IPO: High-Barrier Medical Asset or Working Capital Trap? 🚨
🟢 The Bull Case (The Moat & Smart Money):
Global Validation: Holds a massive 25% domestic market share and ranks as a top-5 stent brand in Germany & Spain, exporting to 77 countries.
Pure R&D Engine: Reinvests an aggressive 8.6% of revenue back into R&D with 119 granted global patents to sustain its future pipeline.
Marquee Backing: Pre-IPO rounds saw anchor entries by institutional giants like WhiteOak, Malabar, and Ashish Kacholia .
🔴 The Risks (Where the Friction Lies):
1️⃣ The Cash Gap: Despite a ₹69.08 Cr PAT turnaround in FY26, Q1 FY27 recorded a Negative Operating Cash Flow of -₹22.21 Cr. Strained by long hospital receivable cycles.
2️⃣ Capital Intensive: SMT operates at an asset turnover under 0.95x. Every ₹1 in advanced machinery generates under ₹1 in sales—it is a heavy manufacturing drag.
3️⃣ Debt Profile: Total borrowings climbed to ₹320.63 Cr in Q1 FY27. Since the IPO is a 100% OFS, no fresh capital enters to clear this debt.
Priced aggressively at 57.91x P/E, SMT mimics global giants like Medtronic in its tech complexity but faces structural balance sheet friction. This is an elite category builder meant strictly for patient, long-term compounders—not short-term listing gains.
🛑 CRITICAL SEBI DISCLAIMER & SAFETY NOTICE:
NOT FINANCIAL ADVICE: This post is strictly for educational, informational, and case-study purposes only. It does NOT constitute a buy, sell, subscribe, or hold recommendation.
MARKET RISK: Investments in the securities market are subject to high market risks. Equity investments, especially unlisted or newly listing IPOs, carry a risk of total capital loss. Read all Red Herring Prospectus (RHP) and offer-related documents carefully before executing any financial transaction.
Past performance is never an indicator of future results. The creator accepts no liability for any financial losses incurred.