

Turn economic complexity into clear insights & visuals. Research, data visualization & content for businesses, media & institutions. 🌐 https://xitter.cf/t.co/LBV0Esyo0E
Global
Joined June 2023
- Tweets4.1K
- Following670
- Followers11.2K
- Likes8.6K






Pinned Tweet
The Global Money Supply Monitor (#GMSM) aims to track, analyze, and monitor global money supply trends across economies, elucidating their relationship with the broader economy and financial markets.
Comprehensive coverage spanning 169 countries.
👇👇👇
econovis.net/global-money-su…

📈 China’s Iran-Linked Oil Imports Plunge Amid War and Hormuz Disruption
📊 Full analysis and 6 charts from Econovis ↓
econovis.substack.com/p/pers…
China’s crude oil imports recorded as originating from Malaysia and Indonesia—widely believed to include substantial volumes of Iranian crude whose origin is obscured to circumvent sanctions—have risen sharply since 2015. Flows accelerated from 2022 onward, averaging 1.55 million barrels per day (mb/d) in 2025 before reaching a record 2.5 mb/d in March 2026.
The surge proved short-lived. Following the outbreak of war and disruptions around the Strait of Hormuz, imports fell to just 0.92 mb/d in June, recovered partially to 1.33 mb/d in August, then dropped to 0.69 mb/d in September. These sharp swings contrast with the more sustained buildup from 2022 to 2025, highlighting the growing volatility of Iran-linked oil flows amid regional conflict, sanctions enforcement, and shipping disruptions.
#China #Russia #SaudiArabia #energy #fuels #oil #crude #CrudeOil #OOTT #Iran #sanctions #HormuzStrait #Hormuz

📈 China’s Crude Oil Imports Plunge, Then Partially Recover
📊 Full analysis and 6 charts from Econovis ↓
econovis.substack.com/p/pers…
China’s crude oil imports peaked at 13.1 million barrels per day (mb/d) in December 2025, the highest level in the 18-month period, and averaged 11.4 mb/d for the year. Imports then fell for six consecutive months, hitting a low of 7.1 mb/d in June 2026—a 38% decline from 2025—before partially recovering to 8.5 mb/d in July and 8.9 mb/d in both August and September. September imports were up 26% from June but remained 22% below the 2025 average.
The decline was concentrated overwhelmingly in shipments from the Persian Gulf region. Imports from the region fell from 6.4 mb/d in February to just 2.1 mb/d in June, while flows from the rest of the world remained comparatively stable at around 4.6–5.2 mb/d, broadly in line with 2025 levels. This divergence suggests that disruptions to Persian Gulf supplies and sourcing played a major role in the spring decline, rather than a broad-based reduction in China’s oil imports. Potential contributing factors include war-related disruptions, sanctions, pricing conditions, and shifts in shipment schedules or contract timing.
#China #energy #fuels #oil #crude #CrudeOil #OOTT #Iran #sanctions #HormuzStrait #Hormuz

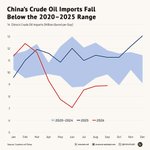
📈 China’s Crude Oil Imports Fall Below the 2020–2025 Range
📊 Full analysis and 6 charts from Econovis ↓
econovis.substack.com/p/pers…
China’s crude oil imports have remained well below their 2020–2025 historical range since April 2026. After starting the year at around 11–12 million barrels per day (mb/d), imports fell sharply from March, hitting a low of 7.1 mb/d in June—below the historical range. Volumes recovered modestly to 8.9 mb/d in both August and September but remained far below the 2025 average of 11.4 mb/d.
The sustained decline points to a significant shift in China’s crude oil import flows. Weaker demand may be one factor, but the scale of the shortfall could also reflect changes in supply availability, sourcing patterns, inventory management, and other market conditions. The weakness is particularly notable given the seasonal tendency for Chinese crude oil imports to strengthen in the second half of the year.
#China #energy #fuels #oil #crude #CrudeOil #OOTT #Iran #sanctions #HormuzStrait #Hormuz

📈 Persian Gulf Oil Shut-Ins Fall From 20% to 6% of Global Crude Exports
📊 Full analysis and 6 charts from Econovis ↓
econovis.substack.com/p/pers…
At their May 2026 peak, Persian Gulf crude oil production shut-ins were equivalent to 19.9% of global crude oil exports and 11.9% of world production—an extraordinary concentration of supply disruptions in a single region. By September, these shares had fallen to 6.2% of global exports and 3.7% of global production, declines of roughly 69% from their peaks.
Throughout the period, shut-ins accounted for a larger share of global exports than of production, reflecting the Persian Gulf’s outsized role in international oil trade. As a result, disruptions in the region can have a disproportionate impact on global oil markets. Although the decline in shut-ins points to a partial recovery in regional supply, the remaining disruptions in September still represented a significant share of global crude oil exports and production.
#Oil #Energy #CrudeOil #Crude #PersianGulf #HormuzStrait #Iran #SaudiArabia #UAE #USA #China #Geopolitics

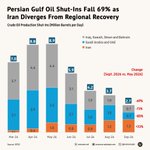
📈 Persian Gulf Oil Shut-Ins Fall 69% as Iran Diverges From Regional Recovery
📊 Full analysis and 6 charts from Econovis ↓
econovis.substack.com/p/pers…
Persian Gulf crude oil production shut-ins relative to the 2025 average peaked at 8.9 million barrels per day (mb/d) in May 2026 before declining 69% to 2.7 mb/d in September. The recovery varied significantly across producers: combined shut-ins in Iraq, Kuwait, Oman, and Bahrain fell 83% from their May peak, while those in Saudi Arabia and the UAE declined 80%. Iran moved in the opposite direction, with shut-ins increasing 33% as the U.S. blockade effectively halted Iranian crude exports.
The divergence mirrors the broader recovery in Persian Gulf oil production. While most regional producers have restored output, Iran’s supply constraints have intensified, reflecting the disruption to its crude exports.
#Oil #Energy #CrudeOil #Crude #PersianGulf #HormuzStrait #Iran #SaudiArabia #UAE #USA #China #Geopolitics

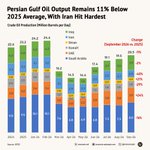
📈 Persian Gulf Oil Output Remains 11% Below 2025 Average, With Iran Hit Hardest
📊 Full analysis and 6 charts from Econovis ↓
econovis.substack.com/p/pers…
Combined crude oil production across the six Persian Gulf producers plunged from 24.4 million barrels per day (mb/d) in February 2026 to 14.4 mb/d in May, a 41% decline in just three months. Output subsequently recovered to 19.1 mb/d in July, 19.5 mb/d in August, and 20.5 mb/d in September, but remained 11% below the 2025 average.
The impact varied sharply across producers. Iran recorded the steepest decline, with September output 40% below its 2025 average, followed by Kuwait (-29%) and Saudi Arabia (-16%). By contrast, the UAE and Oman were the only producers with output above their 2025 averages, at 24% and 21% higher, respectively.
Iranian crude production fell from an average of 3.3 mb/d in 2025 to 2.0 mb/d in September 2026, highlighting the disproportionate impact on Iran’s oil supply and its potential implications for crude exports.
#Oil #Energy #CrudeOil #Crude #PersianGulf #HormuzStrait #Iran #SaudiArabia #UAE #USA #China #Geopolitics

📈 China’s Goods Exports Top $4.4 Trillion as Total Trade Hits Record $7.5 Trillion
China’s total goods trade reached a record $7.5 trillion in the 12 months ending September 2026, as exports topped $4.4 trillion and imports hit a record $3.1 trillion. The resulting trade surplus widened to $1.2 trillion, highlighting China’s growing export strength and its dominant position in global merchandise trade.
#China #trade #exports #imports #TradeSurplus #surplus #TradeWar #tariffs

📈 S&P 500 Market Cap Holds Near $69 Trillion
The total market capitalization of the S&P 500 reached $68.5 trillion on October 16, 2026, remaining near $69 trillion since August. Since the start of the year, the market’s total value has increased by 12.1%, or $7.4 trillion.
#equity #stocks #StockMarket #SPX #finance #investing #trading

Econovis retweeted

Mapped: Where China Out-Trades the U.S. and EU (2000 vs. 2025) 🌐
visualcapitalist.com/mapped-…

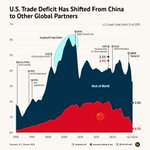
📈 U.S. Trade Deficit Has Shifted From China to Other Global Partners
📊 Full analysis and 5 charts from Econovis ↓
econovis.substack.com/p/us-c…
The U.S. goods trade deficit has moved through oil shocks, the global financial crisis, and the pandemic, but its overall size has changed less than its geographic composition. Since the U.S.–China trade war began in 2018, China's share of the U.S. goods trade deficit has declined substantially, while the deficit with the rest of the world has widened.
Between Q3 2018 and Q2 2026, the U.S. goods trade deficit with China fell from 2.0% to 0.5% of GDP, while the deficit with the rest of the world increased from 2.2% to 2.8%. The divergence is consistent with a significant shift in U.S. sourcing toward other trading partners, including Vietnam, Mexico, and other manufacturing hubs, as companies adjusted supply chains amid tariffs and changing trade policies.
#USA #China #trade #exports #imports #economy #GDP #goods #TradeWar #tariffs #deficit #globalization

Econovis retweeted
Charted: The Three Waves of the U.S. Trade Deficit (1990–2026) 📉
visualcapitalist.com/three-w…

📈 U.S. Trade Deficit Realigns: China Down 61%, Rest of World Up 97% (2018–Q2 2026)
📊 Full analysis and 5 charts from Econovis ↓
econovis.substack.com/p/us-c…
The U.S.–China trade war coincided with a lasting shift in the composition of the U.S. trade deficit. In 2015, the deficits with China and the rest of the world were roughly equal and had moved broadly in tandem. After tariffs and trade restrictions were introduced in 2018, the two trends diverged sharply.
Between 2018 and Q2 2026, the total U.S. trade deficit increased 21%, from $870 billion to $1.05 trillion. Over the same period, the deficit with China fell 61%, from $420 billion to $165 billion, while the deficit with the rest of the world surged 97%, from $450 billion to $890 billion.
By Q2 2026, the U.S. trade deficit with the rest of the world was more than five times larger than the deficit with China, highlighting a major shift in the geographic composition of the U.S. trade deficit and the growing importance of alternative trading partners.
#USA #China #trade #exports #imports #economy #GDP #goods #TradeWar #tariffs #deficit #globalization

📈 Taiwan’s Chip & AI Hardware Exports to China + Hong Kong Reach $135B
📊 Full analysis and 5 charts from Econovis ↓
econovis.substack.com/p/taiw…
Taiwan’s combined exports of chips and data processing units to China and Hong Kong have risen sharply over the past decade, reaching a record $135 billion in the 12 months ending August 2026, up from $43 billion in 2016 and $92 billion in 2023. The split between the two markets, however, obscures the extent of their underlying trade links. Hong Kong functions as a major re-export hub for technology products bound for mainland China rather than solely as an end market. Hong Kong’s chip exports to the world reached $343 billion in the 12 months ending July 2026, with 83%, or $285 billion, going to mainland China.
As a result, Taiwan’s reported exports to Hong Kong likely capture a significant amount of underlying Chinese demand. The $65 billion shipped directly to China and $70 billion shipped to Hong Kong should therefore be viewed together as a broader measure of Taiwan’s exposure to the Chinese market and regional technology supply chains.
#Taiwan #Exports #Trade #AI #Chips #Semiconductor #Tech

📈 U.S. + Mexico Overtake China + Hong Kong in Taiwan’s Chips & Data Processing Unit Exports
📊 Full analysis and 5 charts from Econovis ↓
econovis.substack.com/p/taiw…
Taiwan’s export destinations for chips and data processing units have shifted sharply over the past decade. From 2015 through 2021, China and Hong Kong absorbed 50–60% of these exports, with Hong Kong serving as a major re-export hub for shipments ultimately bound for mainland China. That share began declining sharply from 2022, falling from roughly 60% to just 27% by August 2026. Meanwhile, the U.S. + Mexico share surged from near zero to 39%, overtaking China + Hong Kong in early 2025. The shift also reflects a changing composition of demand: China remains primarily a destination for chips, while the U.S. has become a major destination for data processing units linked to AI infrastructure. Mexico has increasingly served as a processing and assembly hub for hardware ultimately destined for the U.S. market. Together, these changes illustrate the restructuring of Taiwan’s technology trade amid supply-chain diversification, export controls, and surging AI-related demand.
#Taiwan #Exports #Trade #AI #Chips #Semiconductor #Tech

📈 Taiwan’s AI-Related Exports to Mexico Surge to a Record $26 Billion
📊 Full analysis and 5 charts from Econovis ↓
econovis.substack.com/p/taiw…
Taiwan’s exports of data processing units and integrated circuits to Mexico have surged from just $0.8 billion in 2023 to a record $26.3 billion in the 12 months ending August 2026—a more than 32-fold increase in just three years. For much of the previous decade, this trade flow remained minimal before accelerating sharply from 2024 onward. The surge reflects Mexico’s growing role in North American technology supply chains and as a manufacturing, assembly, and processing hub for computing hardware. Its proximity to the U.S. market has also made Mexico an increasingly important link between Taiwan’s semiconductor and AI hardware industry and rising U.S. demand for AI infrastructure.
#Taiwan #Exports #Trade #AI #Chips #Semiconductor #Tech

📈 Taiwan’s AI-Related Exports to the U.S. Surge to a Record $191 Billion
📊 Full analysis and 5 charts from Econovis ↓
econovis.substack.com/p/taiw…
Taiwan’s exports of data processing units and integrated circuits to the United States reached a record $191 billion in the 12 months ending August 2026, up from just $11 billion three years earlier—a more than 15-fold increase. The surge reflects the rapid expansion of AI infrastructure investment and rising demand for advanced chips and AI servers. Together, these exports underscore Taiwan’s increasingly important role in supplying the semiconductor and computing hardware powering the U.S. AI buildout.
#Taiwan #Exports #Trade #AI #Chips #Semiconductor #Tech

📈 AI Hardware Drives Taiwan’s Export Surge to the U.S.
📊 Full analysis and 5 charts from Econovis ↓
econovis.substack.com/p/taiw…
Taiwan’s exports to the United States reached a record $261 billion in the 12 months ending August 2026, with AI-related hardware accounting for the vast majority of the increase. Data processing units and chips totaled $191 billion, representing 73% of Taiwan’s exports to the U.S. Between August 2023 and August 2026, exports of these products surged 1,360%, compared with just 24% growth for all other goods. The stark divergence shows how rapidly AI-related hardware has reshaped Taiwan’s export mix and become the dominant driver of trade with the United States.
#Taiwan #Exports #Trade #AI #Chips #Semiconductor #Tech

Econovis retweeted
Mapped: The Economies Most Dependent on U.S. Trade 🌐
visualcapitalist.com/mapped-…

📈 U.S. Stock Market Cap-to-M2 Hits 350%, Highest Since the Dot-Com Era
📊 Full analysis and 5 charts from Econovis ↓
econovis.substack.com/p/glob…
The ratio of U.S. stock market capitalization to M2 money supply measures equity valuations relative to the amount of money circulating in the economy. The ratio peaked around the 2000 dot-com bubble before collapsing through the early 2000s and the 2008–2009 Global Financial Crisis, then plunged again in 2020 as the pandemic triggered a surge in money supply. Since 2023, an AI-driven market rally has pushed the ratio steadily higher, reaching 350% in Q2 2026—its highest level since the dot-com era.
#MoneySupply #BroadMoney #StockMarket #MarketCap #Stocks #Equities #SPX #Finance #Investing

📈 Copper Prices Hit Record $14,474 per Ton in September 2026
📊 Full analysis and 4 charts from Econovis ↓
econovis.substack.com/p/comm…
Average monthly copper prices reached an all-time high of $14,474 per metric ton ($6.57 per pound) in September 2026, up 45% year over year. Since 2000, copper prices have risen at an average annual rate of 8.9%, shaped by global growth cycles, supply constraints, and the accelerating energy transition.
The 2000s were dominated by a China-driven commodity supercycle, with copper prices rising from below $1 per pound in 2003 to more than $4 in 2008, before collapsing during the Global Financial Crisis. Prices reached another peak in 2011, then declined amid slower Chinese growth and expanding mine supply.
Since 2020, pandemic-related disruptions have tightened supply while demand rebounded sharply. Copper prices surged above $4.70 per pound in 2021 and have risen another 40% since 2022, despite weaker global growth. The latest rally reflects constrained investment in new mining capacity, political and operational disruptions in major producing countries—particularly in Latin America—and rising demand from electrification, renewable energy, data centers, and other energy-transition technologies.
#copper #metal #commodity #investing #trading
