

Canada Mortgage and Housing Corporation (CMHC) Rising to meet housing challenges of today & tomorrow. Français: @SCHL_ca| Terms of use: https://xitter.cf/t.co/9UtTVZZBGw
- Tweets9.7K
- Following105
- Followers28.7K
- Likes2.6K
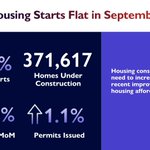








ALT Housing starts flat in September Housing starts trend +0.6% Homes under construction: 371,617 Completions MoM: -0.9% Permits Issued MoM: +1.1% Housing construction levels need to increase to sustain recent improvements in housing affordability

ALT Housing starts trend down 1.3% with 371,658 homes under construction, completions are down 11.2% and permits issued are up 0.7 month-over-month as of August 2026. Text: Housing Stats Continue to Trend Slightly Down While the current pace of housing starts is higher compared to recent years, we expect construction activity to moderate in the coming months.


ALT Headline: Mortgage rates aren't the whole story. More Canadians are choosing shorter-term mortgages, which means interest-rate changes can reach households sooner when it's time to renew. Learn more. A photo of a happy mother and child in their home.

ALT Infographic titled “Canada’s Housing Pipeline Remains Active” (July 2026). Housing starts trend remained stable at approximately 0.5%, with 373,091 homes under construction. Completions increased 8.1% month over month and permits issued rose 3%. The graphic notes that while housing starts moderated in July, a substantial number of homes remain under construction and completions are increasing, indicating ongoing housing supply activity in Canada.

ALT Infographic titled “What’s Changing in Canada’s Affordable Rental Housing? 6th Social and Affordable Housing Survey.” Photo of apartment buildings appears on the left. Key findings on the right state that 1 in 3 units are in fair or poor condition. Rent has increased since 2019: 14% for one-bedroom units, 19% for two-bedroom units, and 31% for units with three or more bedrooms. An upward arrow graphic accompanies each increase.

ALT Graphic highlighting Iqaluit’s rental housing market. Text reads: “Iqaluit’s rental market is effectively full.” Statistics show a 0.3% vacancy rate and that only 6 of approximately 2,000 rental units were vacant. A map of Canada appears on the right with Nunavut highlighted and a location marker indicating Iqaluit. The graphic uses dark blue and purple text on a light grey background.

ALT Graphic titled "Looking Beyond Housing Starts." The graphic shows that 375,469 homes were under construction in June 2026. It also highlights that completions increased 8.4% month-over-month, while the six-month housing starts trend declined 2.8%. Supporting text explains that although housing starts eased in June, homes already under construction and rising completions provide a broader view of how housing supply is progressing.

ALT . Large headline text reads “Housing starts trend.” Supporting stats show +0.5% 6-month trend, -6% Monthly SAAR, YTD actual starts up 3% year-over-year. Footer reads: “Source: CMHC Housing Starts, May 2026.”

ALT CMHC-branded pipeline graphic with three labelled stages: Permits → Starts → Completions. Text states 139K approved units awaiting start, 375K units under construction, and 17K completions in May. Footer reads: “Source: CMHC Housing Starts, May 2026.”

ALT Slide titled “Different markets, different stories.” Down arrow: −12% Toronto. Up arrow: +18% Montréal. Down arrow: −7% Vancouver. Footer reads: “Source: CMHC Housing Starts, May 2026.”

ALT CMHC-branded quote slide featuring Aled ab Iorwerth, Deputy Chief Economist. Quote text as shown. Headshot of Aled ab Iorwerth included.

ALT Dark navy background with a muted map of Canada on the right. White text on the left reads: "More supply. More options. Just not for everyone." Red text box below reads: "Canada's rental market is balancing – just not for everyone."

ALT Infographic titled "Could a city fee be the reason a new home didn't get built near you?" CMHC tested this using the Housing Development Viability Analyzer. Three scenarios are shown using house icons to represent project viability: Under current development charges, many projects don't move forward because the numbers don't work. Cutting charges by 50% makes 5% more projects viable. Removing charges entirely makes up to 14% more projects viable. Takeaway: The higher the fee, the bigger the impact when reduced.

ALT What did over 4,100 recent mortgage consumers tell us about homebuying and mortgages? An image of a smiling family sitting on their couch by moving box.

ALT Infographic titled "April Housing Starts Data Overview" with a red label reading "Housing Starts April 2026." Three upward arrows highlight key statistics: 3.2% increase in the 6-month trend, 17% increase in Monthly SAAR (Seasonally Adjusted Annual Rate), and 6% increase in year-to-date actual starts.

ALT Photo of Mathieu Laberge, Chief Economist at CMHC, standing with arms crossed and smiling, beside a quote that reads: "April gains in housing starts are mainly driven by multi-unit projects already in the pipeline, though volatility remains high and the outlook is still challenging with uncertainty and higher financing costs weighing on new construction. Building permits signal future activity, while housing starts show where construction has begun; together providing a more complete picture of the housing pipeline."

ALT Visual titled “The Renewal Wave Has Peaked. Now What?” highlighting key findings from the Spring 2026 Residential Mortgage Industry Report. Featured data points include: 42% chose variable-rate mortgages, insured loans are rising, and Ontario mortgage delinquencies are increasing.

ALT Does new housing make the rental market more affordable? Get the full research insight


ALT Your Census. Your Community. Our Future. Complete your census questionnaire today: census.gc.ca.